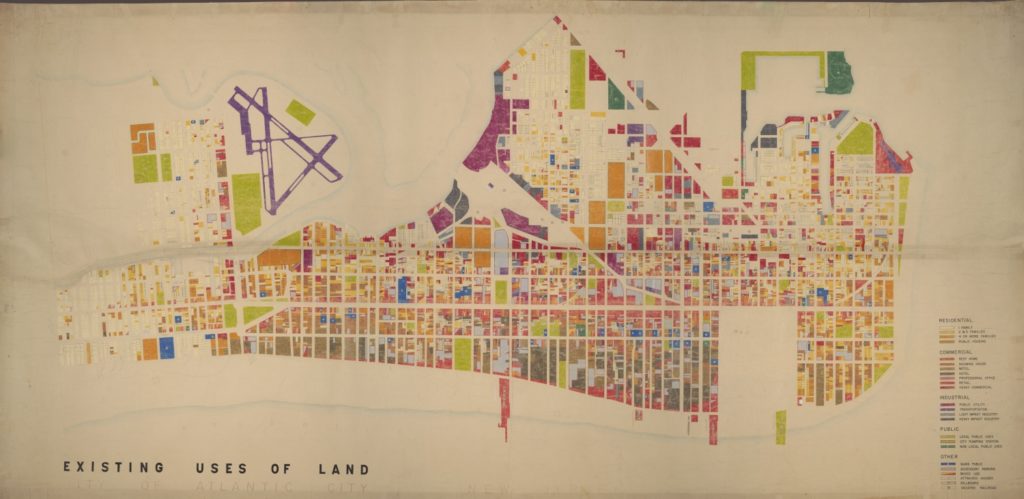
As the name suggests, the maps in this portion of the exhibit show types and intensities of different land uses in a particular area and provide frames of reference for understanding planning practice, including underlying assumptions and methods of simplifying and communicating both existing and proposed changes to land use.
One of the centerpieces of the exhibit is a unique 1966 land-use map of Atlantic City. It was prepared before the era of digitized block and lot mapping utilizing computer land use programs presently used to create color-coded land use maps. Peter Karbashian, one of the co-authors of the map, recalls that the process was completely manual and extremely labor intensive. In addition, quantifying the individual categories of land uses was also a daunting challenge, which required employing a calibrated planimeter to manually calculate the size of each lot and record its land use. The statistics were then recorded on separate tables reflecting the respective categories of land use. The field maps that were used to record individual land uses were the tax map sheets, and represented only small portions of the city. The entire city was “walked” and surveyed lot by lot. While the field work was being completed, draftsmen using the translucent linen drafting material prepared the base map by copying the individual tax map sheets. The field notes were transposed from the tax maps to the base map according to a specific color code created by Dr. E. Wilkins: the lightest colors represent the least intensive while the darker illustrate the more intensive land uses. Ultimately the final map turned into a working tool for assessment of the existing land use pattern. Unfortunately, it was never completed and the streets were never labeled. However, it serves as an excellent example for the pre-software land use map preparation.
In 2012 the co-authors, Peter Karbashian and Tom Sykes donated the map to the Cornell University Library with the help of Prof. Emer. John Reps.
A zoning map of Springfield, MA, prepared by the City Planning Board, Technical Advisory Corporation, and consulting engineers. In addition to the existing and proposed facilities, it provides a snapshot of the city’s population change.

![City plan map of Springfield, Massachusetts (1923). 1:12,000. [Springfield, Mass.: s.n.], 1923. Cornell University Library Collection.](https://olinuris.library.cornell.edu/wp-content/uploads/2020/03/maps3-768x990.jpg)